It’s the start of the third week of arabidopsis growth. Sadly there hasn’t been much growth difference from last week. Some notes:
I noticed that the seedlings in just about every sample aren’t doing too well.
Generally, planting on top of the agar wasn’t the ideal way to plant the seeds.
The seedlings in the most media and planted in the agar are doing alright.
The seedlings in the small jar (with about 4ml of agar) are all dry and the agar is all dried up as well. That sucks.
It’s hard to find a balance between keeping the plants covered and exposing them to air. I fear the lack of air flow is hindering their growth, but leaving them exposed also increases the evaporation rate. Having to constantly replace the water makes this experiment expensive for D2O/DDW studies.
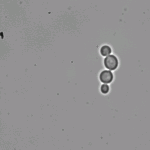
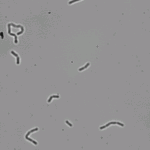
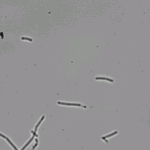
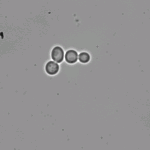
It was discovered that individual cells of D2O adapted yeast are very rod like and potentially fissionable. This indicates either one of two things: (1) there has been contamination and this is either a fissionable yeast or bacteria, (2) D2O fucks shit up really messes with cells and these are really distressed. I’m inclined to believe it is contamination since I wasn’t personally overseeing the yeast propagation for almost 3 weeks.
So to check, (1) I will regrow the yeast cells from the beginning with antibiotics, (2) grow a sample of this stuff with antibiotics, and (3) reintroduce these cells to DDW for a few days to see if the growth reverts back to wt yeast. Any of those experiments could reveal the truth, but I don’t think my yeast is antibiotic resistant so I’d have to figure out some way to achieve that.
The biggest issue is that money is getting tight and D2O and DDW is expensive, so I’ll need to develop some cost cutting methods.
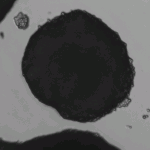
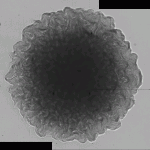
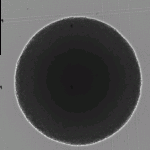
A colony of non-adapted yeast grown on D2O YPD agar.
The yeast colonies grown in D2O agar are finally big enough to compare to the other samples. It took almost a week to grow this much!
Up above is an image of a single colony, and another of a few colonies that have merged together. It seems that in the presence of D2O, the colonies grow quite smooth still, but a little asymmetrically. Since we know (from unpublished research) that D2O stabilizes microtubules, it would be interesting to compare these results with the morphology of colonies grown in taxol (a cancer drug known to stabilize microtubules).
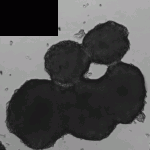
Another D2O adapted yeast grown on normal agar plate.
D2O adapted yeast grown on normal agar plate.
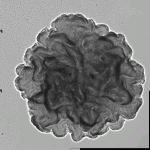
D2O adapted yeast grown on D2O YPD agar.
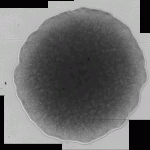
WT yeast grown on normal ypd-agar plate.
These images and the final comparison image (and ALL the original raw files from the camera) are available via the figshare link above. These images were also taken after this post, ie the conditions are the same.
Images were acquired at 10x magnification and the scale is 1um/px. The largest image is 1959×1925 px (the larger D2O yeast on normal agar) and the smallest image is 1462x1749px (the D2O yeast on D2O).
As you can see there is quite the interesting phenomenon here. The interesting thing is that there is something morphologically different about the D2O adapted yeast. The reason for that thinking is because the yeast colony retains its brainy shape when placed on normal media, as compared to the wt yeast on the normal agar (smooth circle). Before I make any bold claims about what may be happening here, I need to read some papers about yeast morphology.
Also if anyone wants a glycerol stock of this strain of yeast to run some tests on it, I’d be happy to send it to you. I personally don’t have the means to perform any advanced tests so any experimentation is welcomed!
After having been adapting wild type yeast to D2O for the past 49 days, I’ve been making some basic observations regarding their growth. Initially wild type (wt) yeast exhibits slowed growth in D2O. Usually the first 24 hours there is relatively little growth and they yeast takes about 72 hours to reach the maximum growth (cell number) as yeast grown in DI water or DDW. But there are also some differences between adapted yeast and wt yeast. I’ve yet to quantify most of these but I’ve noticed some things:
Yeast grown in liquid YPD media. On the left is D2O adapted yeast grown in D2O YPD. On the right is wild type yeast grown in DDW. Yeast was grown at 30C and shaken (not stirred) for 24 hours.
The first of which is the aggregation of the cells in the mediums. D2O adapted yeast (grown in D2O) seem to be less prone to aggregation/clumping. In the image above, there is a pretty high cell count (observed by the cloudy appearance of the medium) in the test tube on the left. There is some settling of cells (which would indicated the cells are clumping), but compared to the test tube on the right (wt yeast grown in DDW) that’s really not a problem. It is important to note that when both samples are resuspended their absorbance are almost identical (3.256 for D2O yeast vs 3.249 for DDW yeast).
We’ve also noticed a difference in color between the cells. It’s not yet sure whether the cells are in face a different color or if this is related to the aggregation characteristic.
Obviously tests will need to be done, and I’m going to get on it. Most of which will be microscope analysis, but hopefully I can speak with some friends over at Cancer Research to perform some advanced tests on the cells.
I’ve also been trying to determine if my yeast cells are officially D2O adapted, and my latest experiment may finally put my own skepticism to rest.
Yeast grown on YPD agar made with 99.9% D2O. On the left is wild type yeast, and on the right is yeast adapted to D2O. The yeast was incubated for 24 hours at 30C.
After 24 hours of incubation, wt yeast grown in D2O greatly struggles (left sample) while my potentially adapted yeast grows like crazy. That looks super conclusive, especially because the same culture of wt yeast grows really well on normal YPD agar plates:
Yeast grown on YPD agar plates (commercial, made with DI water). On the left is wild type yeast and on the right is D2O adapted yeast. The yeast was incubated at 30C for 24 hours.
But interestingly enough, the D2O adapted yeast appears to grow on H2O media much better than wt yeast. If anything I would have assumed the same growth, but the results above are ridiculous. Tempering excitement for a minute, more tests will need to be done, and tomorrow I’ll have some (hopefully) more conclusive data.
With that said, I can’t help but be excited for the future of the project. Let’s see what tomorrow brings!
So based on these results, it appears that there is a difference in growth rates between my adapted D2O yeast and yeast adapted to H2O and grown in D2O. The main evidence is that the absorbance of adapted yeast starts much lower than the nonadapted yeast, and after a couple hours surpasses the cell count of the nonadapted yeast. The nonadapted yeast had exhibited relatively little growth for the first 5 hours of the experiment, while the adapted yeast grew consistently over the duration of the experiment.
The other aspect of this experiment was to compare the growth of yeast in water after different incubation times to determine if the yeast is exhibiting log-phase growth. I would say it most definitely is. Both samples grow at about the same rate, just starting from different cell counts. This also means that the yeast inoculated in D2O was growing at this rate and was severely stressed when placed in the D2O medium.
The next experiments are to compare yeast grown in DDW YPD to yeast adapted and grown in D2O to yeast adapted to H2O and grown in D2O. Hopefully there will be some interesting results. And next from there will be to grow the adapted yeast in H2O to see if H2O causes similar stresses to D2O adapted yeast that D2O causes to H2O adapted yeast.
The results are in. I finished the experiment with a 24h time point and uploaded to figshare. Yesterday I was planning on doing 6h of time points and then a 24h measurement, but I was running low on sample and wanted to provide as much media as possible so I could rerun the experiment next week with a larger cell count for unadapted D2O, which would provide a better gauge of adaptation.
I’m still not quite sure what to think of this data. I’m going to keep the generations of yeast growing and take more measurements down the road. I’m also going to grab some papers on yeast adaptation and growth rates and see if there is something I can use to better determine if I’ve reached my goal.
I do feel at the very least the cells are more tolerant of D2O than they were a little over a month ago. Up next is some microscope analysis. Hooray!
I assure you this data was uploaded yesterday once I took the 24 hour measurements of the cells. That measurement was actually an additional data point I felt added to the data and provided the typical shape of the growth curve of yeast.
With regards to this data, it seems the D2O strain that I’ve been working on is adapting to D2O and its growth is not all that different from yeast grown in DDW, which in past experiments is definitely not the case (Day 1, Day 6, Time Trial 5, Time Trial 4, etc). I compared this growth to the growth of the previous experiments of Days 1 and 6 and got this figure, which shows the results side by side.
More data is needed (and will be attained) but this looks pretty good. Onward!
I hadn’t had the time to post any observations or thoughts, but I just wanted to get the data out there. Well now I have time, so come sit, stay awhile, and listen!
This graph compares the growth of yeast in D2O at 3 different dates: Day 1, Day 6, and Day 33 of the adaptation experiment. Each data set is from the time trials conducted on those dates. So the data shown above is a comparison of the hourly yeast growth of those three different dates.
While I’m remain skeptical that this data shows the yeast I’ve been cultivating for the past month has in fact adapted to D2O, it does seem pretty obvious. The growth of yeast in five hours after being isolated in D2O for 33 days is significantly different than normal (H2O adapted) yeast grown in five hours. Granted the starting cultures are of differing cell counts, the growth rates of all samples are drastically different.
As I mentioned earlier, tomorrow (hopefully) I’ll be running another time trial experiment that will compare the (potentially) D2O adapted yeast to yeast adapted to H2O grown in D2O and H2O adapted yeast grown in DDW (both of these have been inoculated as starter cultures). Hopefully that provides further evidence that this strain of yeast is in fact D2O adapted. If I have in fact attained a D2O adapted strain of yeast, then I will get to move on to some exciting experiments to analyze phenotype changes in the D2O adapted yeast when compared with H2O adapted yeast.
Unbeknownst to most of the world, I’ve had a secret agent specially trained to carry out my experiments while I’ve been away. Before I left for Seattle, I trained my lab colleague Nadia to do the 24 hour yeast adaptation experiments. She’s been keeping the experiment up to date and posting the results in the Google Doc I set up back on Day 1. THANK YOU NADIA!!! You can see the updates at that link or just read down:
This morning is my first day in the lab since my departure and I’m picking up right where I left off, the 27th Generation of yeast in the table above are my first recorded values based on Nadia’s efforts.
Here are the results in typical fashion:
50% yeast (Gen 26) – 2.934 at 24h
99% (gen 26) – 2.862 at 24h
50% (gen 27) – 0.536 at 24h
99% (gen 27) – 0.442 at 24h
The experiment was setup in typical fashion:
9ml of 50% mix of DDW YPD and D2O YPD; 9ml of 99% D2O YPD
1ml of 50% DDW YPD yeast added to 9ml of 50% D2O YPD; 1ml of 99% D2O yeast added to the 9ml of 99% D2O YPD