I just finished some beautiful graphs by combining the aggregation data sets from the protein aggregation studies (Ovalbumin and Catalase). Check them out:

I just finished some beautiful graphs by combining the aggregation data sets from the protein aggregation studies (Ovalbumin and Catalase). Check them out:
I was going to publish some data with explanations very elegantly and awesome. Unfortunately I just found out that I don’t know what like 75% of the data actually is. I’m not going to point fingers but for this I’m sorry. I will still publish some data and I will try to explain what we are both looking at but unless I say for certain what the data is representing then the results can be mostly disregarded. By doing this I hope that I will present information to you like a jury sees evidence that gets stricken from the record (while not actually admissible in court the fact remains the jury did see something that could influence their brains in some capacity, and that’s what I hope to do to you!).
Onward!
I’m going to start with data that I’m positive about so we get off on the right foot. This is the aggregation data for the enzyme catalase which I know nothing about but used because we had it in lab, we had a lot of it, and because ovalbumin wasn’t aggregating and damn it I wanted to see some aggregation.
In the above experiments we are analyzing the aggregation of catalase in D2O vs DI water. In the first data set I’m guessing the enzyme aggregated and we were changing the laser power down. For some reason the machine had difficulty reading intensity counts over 8 million so when it approached that number we had to decrease the power. In the second and third sets, the experiments proceeded as expected. In DI water we were able to visualize aggregation, and in D2O aggregation was suppressed for the same experimental conditions.
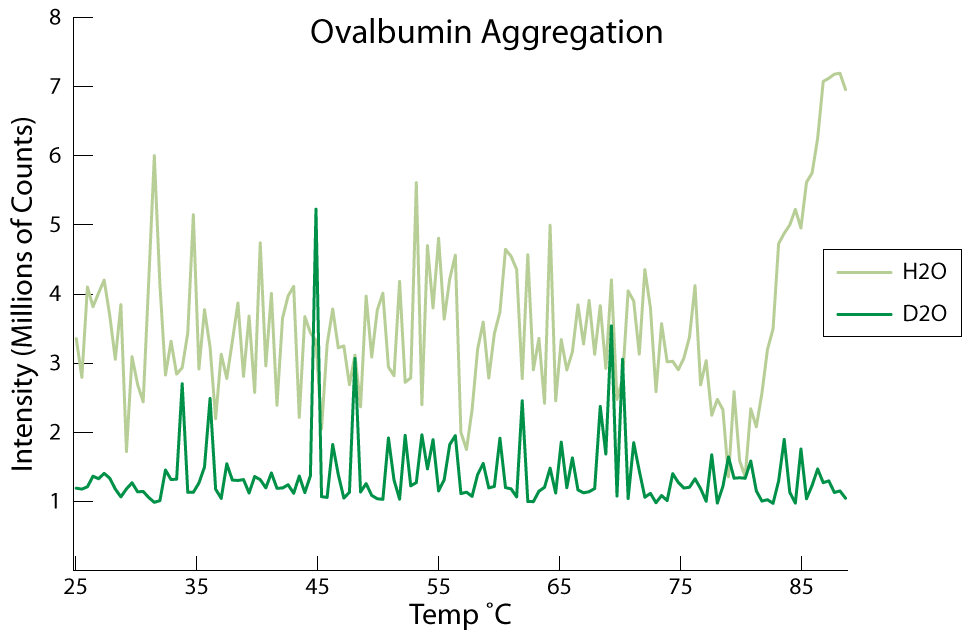
Now we get into the data I’m not sure about, but I would venture to guess that these next sets are ovalbumin aggregation experiments.
I know the data is sloppy, but it is also a bit inconsistent. In these last two experiments, the temperature was raised consistently while taking data from 25C to 90C. Because of the rapid temp increase (10 min perhaps) aggregation was not noticed until the temp was around 85C (instead of the reported 75C). When we took data slower (temp would increase in increments of 5C and hold for 20 data points taken consecutively every 3 sec) the aggregation temp would be closer to 75C.
All work here is done by Kenji Doering (with some help from me and his official mentor Nadiezda Fernandez Oropeza aka Nadia).
Below you will find the final report of the findings of the work that Kenji did regarding the effects of D2O on kinesin stability. (Note: This was surprisingly easier to embed then a youtube video.) I will give a brief summary of his findings and if you want to read more then just check out the Scribd embed below.
Using dynamic light scattering (DLS) we hoped to find that kinesin would be less prone to protein aggregation when suspended in D2O. DLS is a machine that detects laser light scattering to determine particle size in a solution. The machine will attempt to measure the particle sizes, but we only need to know that particles in solution are getting larger and don’t care about the actual number. So for this we just need to know the intensity of the scattered light. A higher intensity reveals larger particles, where a lower intensity means smaller particles.
Proteins tend to denature (unfold) over time but will also unfold if certain conditions are met. A lot of times (all the time?) denaturing can be induced by increasing the environmental temperature. For kinesin this temperature is relatively low (in the mid 40’s C). We tested the hypothesis with ovalbumin which is a rather abundant, cheap, and commercially available protein. Ovalbumin has been documented to denature and aggregate around 75C.
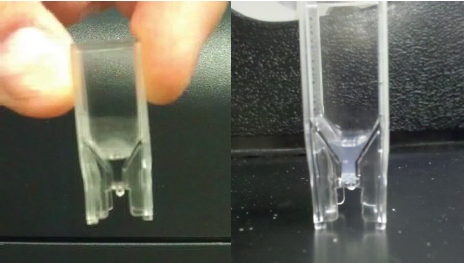
Consistent with the literature, we found that ovalbumin did aggregate around 75C. We also discovered that it would inconsistently do so. According to a literature search by Kenji, he found that ovalbumin may also enter a secondary structure that actually hinders the aggregation process. In many studies, we found that ovalbumin wouldn’t aggregate at all, which we were able to ascertain by eye (when aggregation is achieved the solution becomes a cloudy mixture see Fig 2.0 in the report). In unpublished (as of this moment) experiments we used a different protein called Catalase that seemed to aggregate every try.
While we couldn’t get ovalbumin to aggregate consistently, we did find that it never aggregated in D2O at the same temperatures. In most cases the intensity of the scattered light would rise slightly and then decrease back to the baseline readings. The catalase also didn’t aggregate in D2O (more on this later).
Kenji was able to perform one kinesin experiment with D2O hoping to detect no aggregation. Unfortunately one sample cost $300 and we only had enough commercial kinesin for one sample. While we did see an unsuccessful aggregation event similar to the event in D2O with ovalbumin, one experimental success is hardly grounds for declaration (and Kenji suggests more work needs to be done as well). This is where I pick up the pieces and move forward.
As I said before, you can read his entire written report below. Also I’m making all the Google Doc data public which you can find here.