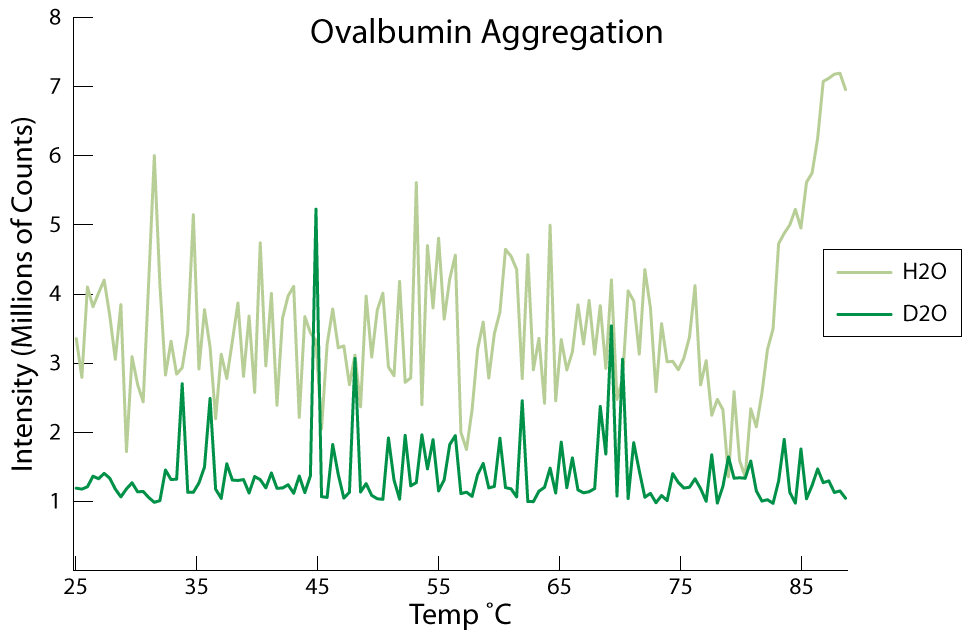
I just finished some beautiful graphs by combining the aggregation data sets from the protein aggregation studies (Ovalbumin and Catalase). Check them out:

I just finished some beautiful graphs by combining the aggregation data sets from the protein aggregation studies (Ovalbumin and Catalase). Check them out: