Category Archives: DDW Effects On Life

Growth of Arabidopsis in heavy water

Arabidopsis seeds in DI water (0.0156% D2O).
Arabidopsis seeds in 33% D2O.
Arabidopsis seeds in 66% D2O.
Arabidopsis seeds in 99% D2O.

Growth of tobacco seeds in low concentrations of deuterium

Growth of tobacco seeds in DDW.
Growth of tobacco seeds in DDW (0.0001% D2O).
Growth of tobacco seeds in DI water.
Growth of tobacco seeds in DI water (0.0156% D2O).
Growth of tobacco seeds in 1% D2O.
tobacco seed root length
Tobacco seed root length growth.

Growth of Tobacco Seeds in Heavy Water

Growth of tobacco seeds in DI water.
Growth of tobacco seeds in DDW.
Growth of tobacco seeds in 33% D2O.
Growth of tobacco seeds in 66% D2O.
Growth of tobacco seeds in 99% D2O.

The Biophysical Effects of Heavy Water – My Defense Presentation

Defense Outline

Just over a week away now…

  1. Introduction
    1. What is D2O?
    2. The history of D2O
      1. Gilbert Lewis:
        1. purification
        2. biological effects
        3. The hypothesis
      2. Joseph Katz
        1. various experiments
    3. Uses of D2O
      1. NMR, mass spec
      2. The need for a D2O adapted organism
    4. Experiments in DDW
      1. use for space travel
      2. cure for cancer?
  2. The effects on life
    1. Tobacco Seeds
      1. The Crumley experiment and repeating the experiment
      2. Tobacco seed germination rate
      3. tobacco seed growth rate in low deuterium concentration
    2. Arabidopsis
      1. arabidopsis growth rate
      2. arabidopsis morphology
    3. E. coli
      1. growth rates
      2. adaptation and adapted growth
      3. morphology
    4. Yeast
      1. growth rates
      2. adaptation – can’t adapt
      3. morphology
        1. stall during cell division
        2. microtubule stabilization in D2O
  3. Molecular effects
    1. Stabilization of biomacromolecules
      1. DLS experiments
        1. Catalase
        2. Ovalbumin
      2. YPD longevity
    2. Investigation of HD exchange
      1. mechanism and exploitation for protein struture studies
      2. FT-IR analysis
      3. Cavity ring-down analysis
        1. low cost measurement of local atmosphere isotopic composition
    3. Effect on DNA
      1. The pursuit of shotgun DNA mapping
      2. optical tweezers
      3. methods
      4. overstretching data
  4. Future Work
    1. Arabidopsis
      1. adaptation
      2. seed growth in low deuterium
    2. Tobacco growth in low D2O
    3. Yeast morphology in taxol
    4. E coli protein expression in D2O and protein structure analysis
    5. DNA
      1. overstretching in D2O with intercalators

Well there is my idea of how to present my dissertation. I’m not sure if/where I should put my discussion on open notebook science. Also there are a couple things that I could see going elsewhere. I could describe the yeast and e. coli stuff in parallel instead of one after another. Also the HD exchange stuff could easily go right after the yeast, e. coli, or even the tobacco seed stuff. What to do…

Otherwise I think the story is pretty compelling: history of D2O and the unanswered question by Lewis. Investigations into D2O effects and trying to understand low D2O concentration effects, effects on macromolecules, and the understanding of large volume/long-term HD exchange.

Any feedback you may have would be GREATLY appreciated. I’ll send you a figshare t-shirt, or if you are XL, I’ll send you a hoodie (but I only have one).

Tobacco Seed Growth Rates

I got some awesome new data to show. The first is the compilation of all the Repeating Crumley experiments. And the second is some new data that I’ve been meaning to create and now have with the help of Koch.

Tobacco seed germination rates

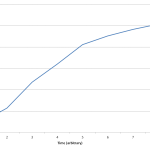
The data above is the compilation of all the RC data. Each trial had different water types, but I combined the samples that were the same in every set (DDW, DI water, 33% D2O, 66% D2O, and 99% D2O). Steve adapted his R-code that applies binomial confidence intervals to a data set and used it on this data. If that makes no sense, then just know that the dotted lines are the most probable range of germination rates. For instance, in 66% D2O there is a ~70% likelihood that seeds will germinate at a rate within the dotted yellow lines.

Now it’s time for some brand new data:

tobacco seed root length

Here we went through the pictures from Trial 5 and compared the growth rates of the roots. We calculated the lengths of various seeds in each image and tracked the changes from image to image. We chose DI, DDW, and 1% D2O, because the D2O concentrations are relatively similar and because we wanted to test a hypothesis from a while ago. It’s interesting that the seeds in DDW and D2O grow at the same rate, while seeds in DI water grow at roughly half the speed.

Looking into hydrogen-deuterium exchange

H-D exchange (or D-exchange as I’ve sometimes referred to it) has been a problem I’ve dealt with in the lab for some time. It is essentially something that I need to minimize but can never actually stop. It is also a process that I know almost nothing about other than it happens, it occurs somewhat instantaneously, but may be mediated by evaporation rates (when dealing with DDW and 99% D2O). Now I’m perusing the internet looking for some information. Come take a walk with me:

  • At ScienceOnline 2013, I met a person who pointed me in the direction of a Dr. Richard Zare. She told me he was very knowledgable in the field and so I looked up his papers. He had five papers relevant to exchange reactions, all of which are way above my head. So I’ll start on Wikipedia and work my way up.
  • For those unaware, hydrogen-deuterium exchange is a reaction where a covalently bonded hydrogen is replaced with a deuterium atom. In the case of my experiments this happen with water. If I have deuterium depleted water and I keep it in contact with the environment (which has deuterium in it at around 16mM), eventually it will reach equilibrium and the deuterium level (of the DDW) will rise. The mechanism that causes this, I presume, is D-exchange.
  • Apparently the reaction is pH dependent. It can be quenched around pH 2.6, but seems to work best at pH 7.0-8.0. That’s really interesting to me. The pH levels that I’m normally working around are optimal for these reactions. Unfortunately there is nothing I can do about that.
  • The reaction may also be quite slow. According to Wikipedia, exchange is slow/unlikely intramolecularly, but is quite rapid via exposed surface hydrogen bonds. For the purposes of NMR, in vivo deuterium incorporation would be valuable and is hard to attain by dissolving proteins in D2O.
  • The first person to measure H-D exchange was Kaj Ulrik Linderstrøm-Lang, and I would read some of his stuff right now but they are locked down. The mechanism he used to study D-exchange was pretty interesting and involved a density gradient tube. If I read this correctly, KULL filled a long tube with oils of different desities. He could place a drop of water, with a small amount of proteins in the drop, into the oils to determine the density. As reactions occur, the density would change and the drop would move accordingly.

Ok I’ve reached the limit of what I can do tonight without using the UNM network for access to papers. I’ll try to look for more information this weekend. The quest for a basic understanding of H-D exchange continues…

Paper Summary: Adaptation of Arabidopsis to D2O

C. R. Bhatia and H. H. Smith, “Adaptation and Growth Response of Arabidopsis thaliana to Deuterium,” Planta, vol. 80, no. 2, pp. 176–184, 1968.

Looking for papers on yeast adaptation (of which I’ve found precisely one!) I came across this paper where they attempted to adapt arabidopsis to D2O. I was instantly intrigued and downloaded the paper for brain consumption. I will now take notes on the paper with the intent of setting up an experiment that can run with minimal effort on my part.

  • A paper that is mentioned in the intro that reviews all the genetic and cytological effects of D2O, seems like an interesting place to check out next for work with the yeast project.
    • Flaumenhaft, E., S. Bose, H. L. Crespi, and J. J. KATZ: Deuterium isotope effects in cytology. Int. Rev. Cytol. 18, 313–361 (1965).
  • Concerning the possible biological action of deuterium, it is known
    that substitution of deuterium in hydrogen bonds of essential macro- molecules (nucleic acids and proteins) changes the properties of these molecules by increasing bond strength and also by a general retardation of reaction rates.
  • Methods:
    1. seeds were surface steralized in 3% hydrogen peroxide and 90% ethanol (a 1:1 mixture) for one minute
    2. seeds were sown into mineral media mixed with 0.78% agar – I’ll have to find out what mineral media is available in 2012. Also I find it strange that in this paper they say what products they use, except for the mineral media. If it’s made in house, why don’t they say what the composition is?! Argh!! It’s always the important detail that is left out…
    3. seeds were grown in test tubes, and closed with glass caps.
    4. samples were cold treated for 5 days at 4C and then moved to a climate controlled box maintained at 24C and under constant illumination (they use some fluorescent lighting and I’m assuming they are 1960’s grow lamps)
  • Results:
    • they did 2 experiments: one was a germination experiment much like the experiments I did in the repeating crumley series, the other was the full adaptation experiments, in all experiments seeds were grown at 0, 10, 30, 50, 70, and 90% D2O
    • in both experiments they looked for morphological differences from normal plants
    • in the first generation of plants, they found germination rates to be increasingly delayed with increasing concentrations of D2O. This is pretty consistent with with the results I linked to above, although they counted germination from the emergence of the first leaves, whereas I looked for any emergence from the seed coat.
    • they also discovered that the green-ness of the plant decreased with increasing D2O conc. and the survival rate of the plants also decreased. No plant produced seeds above 50% D2O in this first generation.
    • flowering rates were also lower in samples with higher d2o amounts. the authors subtracted out the germination delay to determine an average flowering time and saw that that increased with increasing d2o concentration.
    • as for the adaptation experiment, they say they screened over 850 plants, but only have growth information for plants grown in 50% D2O. They find that after 6 generations of growth on 50% D2O seeds can survive to maturity at 70% D2O and seeds obtained from these plants grow normally in the first generation on H2O media. They conclude that the D2O adaptation is not genetic because of this. I would like to add that I’m highly skeptical of the adaptation efforts included in this paper. There are no counts of the number of plants per generation, the number of seeds planted, etc.
    • they hint that they would are taking measures to develop mutants that can grow at concentrations of D2O that are above 70%, I’m guessing they failed because the papers that cite this paper are not by the authors.
  • This paper has been cited twice according to the internet:
    1. Brown, B. T. (1972) A new screening procedure for detecting plant growth regulating compounds. Pesticide Science 3(2)
    2. Foston, Marcus B. (2012) Deuterium incorporation in biomass cell wall components by NMR analysis. The Analyst 137(5)

This paper must have been one of the last studies on organism development in D2O, especially because the papers that cite this paper are in unrelated fields and this is one of the most recent papers I’ve seen in this field. With that said, I’m a little skeptical of the effort to obtain D2O adapted arabidopsis.

I am impressed that they wanted to answer the question of whether H2O affects D2O adaptations in similar ways that D2O affects H2O adaptations. I don’t think their study was thorough enough and growing plants in 50% D2O still leaves the room for plants to get the H2O requirements. I think growth at levels above 70% would be key to obtaining true D2O adapted plants.

Their methods seem pretty simple and I could work on my own version of this experiment pretty easily and have already looked up product information regarding plant growth in the lab:

  • http://www.sigmaaldrich.com/catalog/product/sigma/a1296?lang=en&region=US
  • http://www.sigmaaldrich.com/catalog/product/sigma/m5524?lang=en&region=US
  • and a protocol: http://www.biosci.ohio-state.edu/~plantbio/Facilities/abrc/handling.htm

I’ll order those things tomorrow morning. And tomorrow I read a paper about D2O-Yeast adaptation!

New Yeast

I have no idea when this will get here, but I put in an order for some new S. cerevisiae. I think on Monday I’ll have Alex grow another starter culture and then on Tuesday, we’ll try and get better resolution under the microscope than we got last time.

Anyways, here is what I’ve ordered (from ATCC.org).

E. coli growth experimental setup and data (on FigShare)

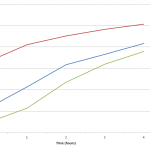
E. Coli Growth over 4 hours. Anthony Salvagno, Alexandria Haddad. Figshare.
Retrieved 20:17, April 20, 2012
hdl.handle.net/10779/b627469dabcd4034053cc53040d4dcbd

I went through the data that I posted on Tuesday and realized it was even less useful to people than I expected. I almost didn’t even know what I was looking at! Anyways, I did a couple of plots in excel with the data (which can be found on FigShare along with both the original data and the revised and cleaned data) and tried to extrapolate some other information. But first let’s discuss the experimental setup.

So on Monday, Alex created a starter culture from the E. coli we grew on plates last week. Then on Tuesday (I realize how not very real-time this post is for me, but the data came out in real-time which is also important) we made 3 dilutions of the starter culture to track the growth of the E. coli over time. We did:

  • 1ml in 9ml of LB broth (1:10)
  • 2m in 8ml of LB broth (1:5)
  • 5ml in 5ml of LB broth (1:2)

Every hour we took an absorbance reading from the nanodrop and read the 600nm value (A600 according to the machine). We also reblanked every hour according to the instructions from the nanodrop. The initial readings were:

  • starter culture – 1.076
  • 1:10 – 0.097
  • 1:5 – 0.23
  • 1:2 – 0.665

It is interesting to note (and I literally just noticed this), that the initial readings are almost exactly what the dilutions are, ie 0.097 is ~1/10 of 1.076. Good for us!

In the FigShare data, you will find the original data (which I linked to in my post on Tues, but in Google Docs instead of Excel) and a revised data set. The data is messy but the graphs are interesting.

Also I tried to link the 3 data sets together into one coherent graph, but the time series doesn’t seem to match up right, or maybe it does and I just think it doesn’t. The 1:5 dilution seems to provide a bridge between the data in the 1:10 dilution and the 1:2 dilution. After about 2 hours the 1:10 sample overlaps with the 1:5 and likewise the 1:5 begins to overlap with the 1:2. Also at hour 3, the 1:10 sample overlaps with the 1:2 sample.

Because of this I tried to graph the data as one continuous set. It seems Like it may be alright, but I feel that the in the 1:2 sample there isn’t much growth in the 4 hours, which is reflected in the 3 data set plot, but it doesn’t look like it peaks in the continuous graph. Hmmm… Anyways check out the FigShare data.

PS I’m including the two plots I’m referring to below.