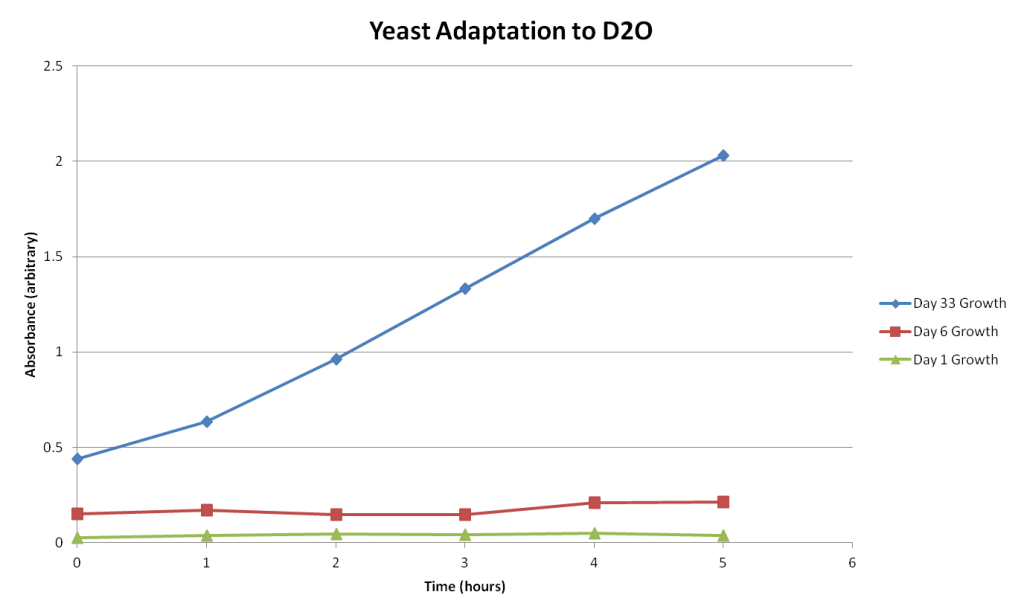
Yesterday I uploaded this graph:
 I hadn’t had the time to post any observations or thoughts, but I just wanted to get the data out there. Well now I have time, so come sit, stay awhile, and listen!
This graph compares the growth of yeast in D2O at 3 different dates: Day 1, Day 6, and Day 33 of the adaptation experiment. Each data set is from the time trials conducted on those dates. So the data shown above is a comparison of the hourly yeast growth of those three different dates.
While I’m remain skeptical that this data shows the yeast I’ve been cultivating for the past month has in fact adapted to D2O, it does seem pretty obvious. The growth of yeast in five hours after being isolated in D2O for 33 days is significantly different than normal (H2O adapted) yeast grown in five hours. Granted the starting cultures are of differing cell counts, the growth rates of all samples are drastically different.
As I mentioned earlier, tomorrow (hopefully) I’ll be running another time trial experiment that will compare the (potentially) D2O adapted yeast to yeast adapted to H2O grown in D2O and H2O adapted yeast grown in DDW (both of these have been inoculated as starter cultures). Hopefully that provides further evidence that this strain of yeast is in fact D2O adapted. If I have in fact attained a D2O adapted strain of yeast, then I will get to move on to some exciting experiments to analyze phenotype changes in the D2O adapted yeast when compared with H2O adapted yeast.