Tag Archives: failed

D2O Adaptation Day 36

Results:

  • DDW yeast growth – 3.240 at 24h
  • 50% D2O yeast (gen 29) – 3.044 at 24h
  • 99% D2O yeast (gen 29) – 3.207 at 24h
  • 50% D2O yeast (gen 30) – 0.629 at 0h
  • 99% D2O yeast (gen 30) – 0.664 at 0h

And the setup for day 37:

  • 9ml of YPD of each water type (50% D2O (4.5ml of DDW, 4.5ml of D2O) and 99% D2O) with 1ml of culture from previous generation.

Glycerol Stock Creation

I made glycerol stocks of the yeast that started the entire D2O adaptation experiment, and now that I may have a D2O adapted strain I made another glycerol stock for safeguarding. I used the protocol found here for reference, with the exception that I doubled the recipe.

D2O Adaptation Day 33 Time Trial Results

Via figshare:

Yeast Adaptation Day 33. Anthony Salvagno. figshare.
Retrieved 21:48, Oct 31, 2012 (GMT)
http://dx.doi.org/10.6084/m9.figshare.96961

I assure you this data was uploaded yesterday once I took the 24 hour measurements of the cells. That measurement was actually an additional data point I felt added to the data and provided the typical shape of the growth curve of yeast.

With regards to this data, it seems the D2O strain that I’ve been working on is adapting to D2O and its growth is not all that different from yeast grown in DDW, which in past experiments is definitely not the case (Day 1, Day 6, Time Trial 5, Time Trial 4, etc). I compared this growth to the growth of the previous experiments of Days 1 and 6 and got this figure, which shows the results side by side.

More data is needed (and will be attained) but this looks pretty good. Onward!


D2O Growth Comparison Thoughts

Yesterday I uploaded this graph:
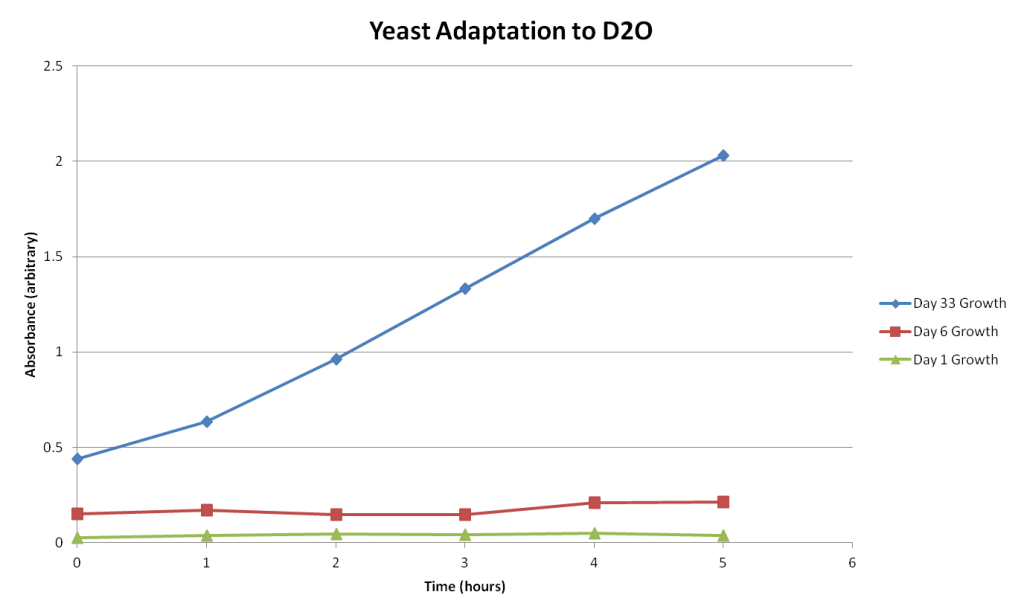
I hadn’t had the time to post any observations or thoughts, but I just wanted to get the data out there. Well now I have time, so come sit, stay awhile, and listen!

This graph compares the growth of yeast in D2O at 3 different dates: Day 1, Day 6, and Day 33 of the adaptation experiment. Each data set is from the time trials conducted on those dates. So the data shown above is a comparison of the hourly yeast growth of those three different dates.

While I’m remain skeptical that this data shows the yeast I’ve been cultivating for the past month has in fact adapted to D2O, it does seem pretty obvious. The growth of yeast in five hours after being isolated in D2O for 33 days is significantly different than normal (H2O adapted) yeast grown in five hours. Granted the starting cultures are of differing cell counts, the growth rates of all samples are drastically different.

As I mentioned earlier, tomorrow (hopefully) I’ll be running another time trial experiment that will compare the (potentially) D2O adapted yeast to yeast adapted to H2O grown in D2O and H2O adapted yeast grown in DDW (both of these have been inoculated as starter cultures). Hopefully that provides further evidence that this strain of yeast is in fact D2O adapted. If I have in fact attained a D2O adapted strain of yeast, then I will get to move on to some exciting experiments to analyze phenotype changes in the D2O adapted yeast when compared with H2O adapted yeast.

D2O Adaptation Day 35

Back on track here are the Day 35 results:

  • DDW Yeast – 3.111 at 24h
  • 50% D2O yeast (gen 28) – 2.969 at 24h
  • 99% D2O yeast (gen 28) – 3.007 at 24h
  • DDW Yeast – 1.192 at 0h
  • 50% D2O yeast (gen 29) – 0.606 at 0h
  • 99% D2O yeast (gen 29) – 0.806 at 0h

I set up the next day’s experiment with some added twists. I have a total of 9 samples for tomorrow, 3 samples of each water type:

  1. yeast in 99% DDW YPD
  2. yeast in 99% D2O YPD
  3. yeast in 50% D2O YPD

The first set of samples (1 of each type) is prepared as I normally prepare an experiment: 9ml of ypd with 1ml of ypd with culture.

The second set of samples (1 of each type) is 9ml of each water type with a culture inoculated from the Day 34 samples. By this I mean instead of adding 1ml I added whatever the inoculating sticks can hold and swooshed it around in the sample. The goal of this is to see how much yeast can grow in 24 hours from a small number of cells. In my original starting culture samples, the cells in D2O would grow astronomically slower than in DDW and my assumption is that if my cells are truly adapted the difference in growth won’t be so drastic.

The third set of sample (1 of each type) is 9ml of each water with a culture inoculated from glycerol stocks I made of samples from the first week of experiments. All the samples are inoculated from DDW grown yeast. The purpose of this set is so that I can do a time trial of the (potentially) adapted yeast compared to nonadapted yeast grown in D2O and with DDW yeast. And if that experiment reveals that my yeast is adapted to D2O, I would like to compare yeast grown in D2O to yeast adapted to D2O and to yeast grown in and adapted to H2O.

Exciting times ahead!

D2O Adaptation Day 34

I was way out of it yesterday. I completely forgot to write up my Day 34 adaptation results! Rest assured I did the experiment and documented the results and set up the next day’s experiment, but just missed the recording function. Anyways here is what you are clamoring for:

  • 50% D2O Yeast (Gen 27) – 3.01 at 24h
  • 99% D2O Yeast (Gen 27) – 3.078 at 24h
  • 50% D2O Yeast (Gen 28) – 0.293 at 0h
  • 99% D2O Yeast (Gen 28) – 0.357 at 0h

I also set up the experiment for Day 35 and added a special guest: DDW YPD (1.362 at 0h), mostly because I had the time trial experiment from the day before and I wanted to compare another 24 hour growth to DDW adapted yeast. So the day 35 results will feature 3 samples:

  • Yeast grown in 99% DDW
  • Yeast grown in 50% D2O
  • Yeast grown in 99% D2O

D2O Growth Comparison

It looks like the yeast is beginning to adapt, or has adapted and is ready for the next phase of the experiment. I’ll write more information later because I need to eat, but enjoy this simple graph and feel free to leave some comments below.

D2O Yeast Adaptation Day 33: Time Trials Setup

In addition to the Day 33 daily adaptation I’m going to run an hourly experiment to see if the yeast has adapted or evolved or changed. I’ll be looking for a growth rate that is faster than in previous trials, and more comparable to yeast growth in DDW YPD. Here is my setup:

  1. Prepare the YPD in test tubes, I’m doing final volumes of 10ml:
    • 95% DDW – 9ml of DDW YPD
    • 35% D2O – 6ml of DDW YPD, 3ml of D2O YPD
    • 50% D2O – 4.5ml of DDW YPD, 4.5ml of D2O YPD
    • 65% D2O – 3ml of DDW YPD, 6ml of D2O YPD
    • 99% D2O – 9ml of D2O YPD
  2. Add yeast:
    • add 1ml of yeast grown in 50% D2O YPD to all test tubes except the 99% D2O YPD
    • add 1ml of yeast grown in 99% D2O YPD to the 99% D2O YPD test tube
  3. Incubate at 30C
  4. Measure in Nanodrop hourly starting at t=0. The starting absorbance values are:
    • 95% DDW – 0.511
    • 35% D2O – 0.512
    • 50% D2O – 0.505
    • 65% D2O – 0.634
    • 99% D2O – 0.439

D2O Adaptation Day 33

Unbeknownst to most of the world, I’ve had a secret agent specially trained to carry out my experiments while I’ve been away. Before I left for Seattle, I trained my lab colleague Nadia to do the 24 hour yeast adaptation experiments. She’s been keeping the experiment up to date and posting the results in the Google Doc I set up back on Day 1. THANK YOU NADIA!!! You can see the updates at that link or just read down:

This morning is my first day in the lab since my departure and I’m picking up right where I left off, the 27th Generation of yeast in the table above are my first recorded values based on Nadia’s efforts.

Here are the results in typical fashion:

  • 50% yeast (Gen 26) – 2.934 at 24h
  • 99% (gen 26) – 2.862 at 24h
  • 50% (gen 27) – 0.536 at 24h
  • 99% (gen 27) – 0.442 at 24h

The experiment was setup in typical fashion:

  1. 9ml of 50% mix of DDW YPD and D2O YPD; 9ml of 99% D2O YPD
  2. 1ml of 50% DDW YPD yeast added to 9ml of 50% D2O YPD; 1ml of 99% D2O yeast added to the 9ml of 99% D2O YPD
  3. put in incubator at 30C