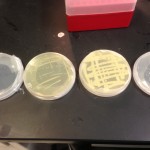
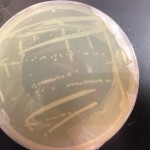
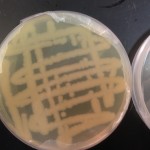
Here are the results of yesterday’s setup. Here I’m comparing 4 samples:
- Wild type (WT) E. coli grown on DI LB agar
- WT E. coli grown on D2O LB agar
- D2O adapted E. coli grown on DI LB agar
- D2O adapted E. coli grown on D2O LB agar
All 4 samples were incubated for the same amount of time, and taken from starter cultures of similar absorbance. The absorbances of the starter cultures are as follows:
- Wild type (WT) E. coli grown in DI LB – 0.641
- WT E. coli grown in D2O LB – 0.325
- D2O adapted E. coli grown in DI LB – 0.489
- D2O adapted E. coli grown in D2O LB – 0.112
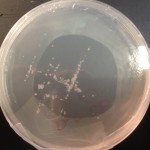
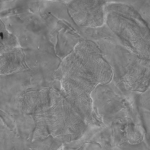
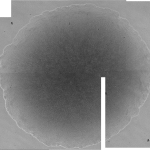
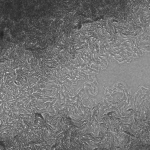
The D2O adapted E. coli took over the DI LB plate! I’ve re-inoculated those cells from that plate to get a picture that would show a typical colony and compare that morphology to the rest. I’ve also allowed the two D2O media samples to incubate for another 24 hours.
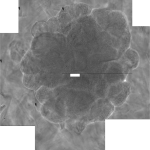
It should also be said that the D2O adapted colonies grown on D2O media look distressed compared to the WT colonies on DI media. But compare the two D2O adapted colonies and it’s tough to discern. Whatever mechanism gives the colonies a distressed appearance on D2O media, seems to be completely uninhibited on DI media. It’s tough to tell if the cells are distressed or just out of control.
Still these results seem pretty comparable to the last time I did these experiments (except using YPD). I’ll update again tomorrow, and insert these results into my dissertation.