Setup. I actually did this experiment yesterday, but time constraints prevented me from posting the live results (which is funny because that requires literally 5 minutes, oh well). Anyway here is some fun data:
Tag Archives: data
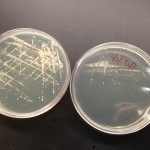
40% D2O Yeast colonies comparison
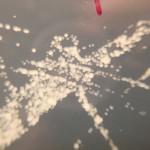
Attached are some images taken of the colonies with my iPhone, my iPhone macro lens, and my iPhone microscope (respectively). Notice the difference in growth and colony size:

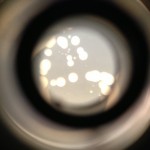
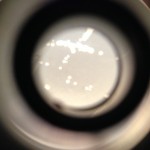
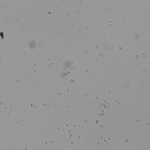
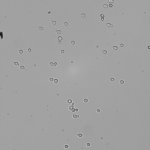
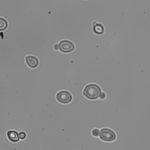
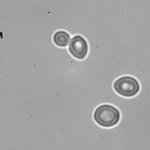
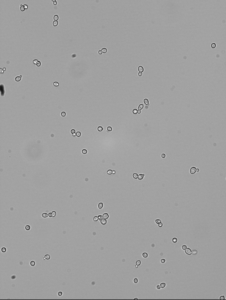
40% D2O yeast cell morphology
It is tough to determine differences between the 20% D2O cells and these, but they appear slightly more spherical and also a bit larger. Evidence of stalled cellular division is not yet apparent. Check out the cells:
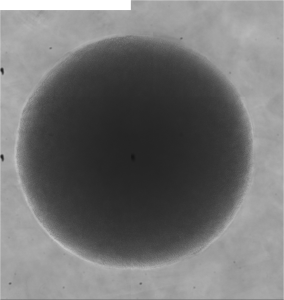
40% D2O yeast colony morphology: Part 1
The colonies are not nearly as well developed as those grown on 20% D2O, but there is evidence of stress even at this stage. The colonies (1) are obviously smaller than the 20% D2O growth, and (2) have a little less spherical symmetry. I’ll continue to grow the yeast in the incubator and check the progress tomorrow (but once before I leave tonight).

20% D2O yeast colony morphology
The yeast grown on 20% D2O YPD exhibits growth not all that different from yeast grown on normal DI water plates. It’s tough to ascertain colony growth time because analysis was not performed in time intervals. Check out what a standard individual colony looks like:
40% D2O Yeast Growth Time Trial 2 Live Results
40% D2O Time Trial
Time for my weekly Time Trial experiment. This time I pit the growth of yeast in 20% D2O vs yeast grown in 40% D2O.
Yeast in 20% D2O
Yeast in 20% D2O Time Trial 2 Live Results
D2O Adaptation Live Results
Here are my daily results. Each week I will be increasing the % of D2O in solution, starting at 20% D2O.