Tag Archives: data

An alternative analysis to FT-IR to study deuterium exchange

Via figshare:

Deuterium Content of Deuterium Depleted Water: 1st Trial. Anthony Salvagno, Scott Jasechko. figshare.
Retrieved 21:24, Jul 20, 2012 (GMT)
http://dx.doi.org/10.6084/m9.figshare.93089

A few days ago I made a new friend named Scott Jasechko. We met to discuss the possibility of creating a TED branded forum to UNM. We got to talking about our research and it turned out that our research interests are very much aligned and he studies water isotope amounts with relation to natural water around the planet. He’s about to publish his findings and once that goes through I’ll link to that.

It turned out that his lab has a device that can very accurately measure small concentrations of deuterium and oxygen-18 in water samples. I told him about my DDW experiments and how deuterium exchange may affect my experiments, but that I can’t quantitatively measure it’s affect or the process in general. So we got to talking and he wanted to help me out.

The data linked above is the results of the mini-collaboration that I predict will turn into more. Scott used his Picarro cavity ring down spectroscope, which means very little to me right now, to analyze the water samples I gave him. The water was used in these two experiments (each word is a separate link). And was then stored in our desiccator (with drierite to reduce moisture exchange) until yesterday (July 19, 2012).

Surprisingly, the data shows very little change from what Sigma claims (less than 1 part per million D to H) to yesterday, showing very little exchange. There are two things to consider here: (1) the machine wasn’t calibrated for such low levels of D, which skew the readings (since they actually give us negative ratios), and (2) volume may play a part in exchange.

I don’t understand the mechanism very well but I suspect that surface interactions play the largest role in deuterium exchange. Once deuterium is introduced into the sample, then I would guess diffusion takes over, but this is probably slower in nature than evaporation/other mechanisms that are involved on the surface. Basically this is a thermodynamics problem that I would need to spend 3 months thinking about to compare with experimental analysis (since that is how long the Thermo class is, 1 semester).

The follow up to this experiment should be better organized. Obviously we’ll need to redo this experiment. Scott and I are also performing another experiment where Scott has left the lid off the samples I gave him so he can see if there is a new value the spectroscope provides. From here we may want to do some longer time analysis and some other studies that we’ll have to plan. I’ll start a new thread for that, in the mean-time I hope he’ll introduce himself in the comments of this post.

Some other notes:

  • I geeked out when I realized the power of this sort of collaboration. If I hadn’t been affiliated with TEDxABQ and thus this new idea of TEDxUNM (not officially licensed), I would have never met Scott. These are the sorts of collaborations that I hope can be introduced because of the Open Research IGERT proposal.
  • I mega-geeked out when I realized I can do a project planning thread with someone here at the university in another lab that can also participate in the project! Open science at the core all the way.
  • I super-mega-geeked out when I realized that I implemented a crucial aspect of ONS. As I wrote this post I wondered what experiments I had used the water for. Then I realized that it’s all documented and that I can show everyone what those experiments are. It’s not enough that I have it recorded by date, but also that you all saw those experiments in real-time and their use in future experiments has been realized. That’s a major win for ONS.
Yeast Time Trials in DI, DDW, and D2O: Trial 5 Results

Via figshare:

Yeast Hourly Growth in DI, DDW, and 99% D2O. Anthony Salvagno. figshare.
Retrieved 21:15, Jul 03, 2012 (GMT)
http://dx.doi.org/10.6084/m9.figshare.92771

Notes:

  • I had a meeting this morning regarding the IGERT I speak so frequently of. That means the timed data wasn’t so consistent in the beginning. I took my first time point about 25 minutes after I set up the experiment. And then I took my second time point 2 hours later. The raw data will show that I took the first time point about 20 minutes later, but I assure you the time difference was more than that.
  • I did take the rest of the time points an hour apart.
  • I spilled a considerable amount of the D2O sample (which was in the beaker), maybe like 30-40% of it after I took the first time point.
  • In data news, I find it really strange that the yeast in D2O didn’t grow nearly as much as it did in the past. I’m wondering if the new setup had anything to do with that.
  • Also it looks like yeast in DDW grew more than the yeast in DI. Again I’ll have to do another run to verify, but I feel like this could be a real result.
  • The added volume definitely improved the results, as the yeast remained suspended in the flasks. In the previous trials I would get considerable settling because the test tubes wouldn’t swirl as much. Much better setup.

So the moral of this story is, I’ll have to do another trial of this setup. Fine by me! Whatever it takes to get good results that are repeatable. That’s the nature of open notebook science!

Yeast Hourly Growth Trial 4: Results

Via FigShare:

Yeast Hourly Growth in DDW, DI, 30%, 60%, and 99% D2O. Anthony Salvagno. Figshare.
Retrieved 20:23, Jun 21, 2012 (GMT)
http://dx.doi.org/10.6084/m9.figshare.92564

A quick note: It seems the growth increases steadily over time, but the accumulation of cells on the bottom of the test tubes is both annoying and startling. This affects the readings and explains why the growth increases dramatically across the board between hours 3 and 4 (when I mixed the test tubes before putting 400ul in the cuvettes for measurement). Maybe using larger volumes would be helpful?


Hourly Yeast Growth Trial 3: Results

Via Figshare:

Hourly Yeast Growth in DDW, DI Water, 30%, 60% and 99% D2O. Anthony Salvagno. Figshare.
Retrieved 21:17, May 30, 2012 (GMT)
hdl.handle.net/10779/03ec08019a22d82c66167d5e7d914de5

This experiment went much better and more predictably. Yeast (unlike E. coli) is more sensitive to deuterium content and grows accordingly. Interestingly (in this experiment) the DDW sample exhibited more growth. I’ll have to experiment on this a bit more.

It should be noted that while it appears that pure D2O grows much slower than the rest (cause it does), I also started with a much lower amount of cells. The cells did not grow well in the starter culture, and they didn’t grow well here either. See the data (or the live results) for starting absorbance readings.

Yeast hourly growth in DI, DDW, and 30%, 60%, 90%, and 99% D2O

Results:

Yeast growth in DI, DDW, and 30%, 60%, 90%, and 99% D2O. Anthony Salvagno. Figshare.
Retrieved 21:20, May 24, 2012 (GMT)
hdl.handle.net/10779/caa57855586213d79eea5576f8da23d0

Notes:

  • I don’t think this is a reliable data set. Several of the samples actually read a lower absorbance after the first hour than they initially do. And then they all dip again at hour 4.
  • I noticed a considerable amount of cell settling after hour 3 on the bottom of each test tube. I mixed prior to reading the absorbance values, but this is likely to skew the results. Next trial I will have to mix before reading every hour.
  • The data between DI, 30%, 60%, and 99% D2O look consistent with Tuesday’s results, but it scares me that the DDW and 90% D2O are completely out of whack.

Yeast Growth at RT: Data and comments

Via figshare:

Yeast Growth at RT in D2O and DI water. Anthony Salvagno. Figshare.
Retrieved 18:10, May 23, 2012 (GMT)
hdl.handle.net/10779/736ebb6f977250f55e9d2bbb12f4f796

First let me explain the experimental setup:

  • This is a carry over from yesterday’s experiment. With the setup here.
  • Every hour I took data from the cultures I inoculated. I put 500ul in semi-micro cuvettes to measure in the nanodrop.
  • After I take data, typically I store the measured cuvettes at RT on the lab top in a cuvette holder (the cuvettes are sealed with PE caps).
    • Originally I did this because I wanted to take a picture to compare the growth after the full experiment was completed, but I noticed with e. coli that the cultures continue to grow at RT, so a picture wouldn’t reveal anything or be accurate.
  • After this experiment I decided to use the nanodrop to compare the growth at RT from all the samples (with the more recent samples having less time to incubate at RT for obvious reasons).

Linked above is the results of the experiment with the excel file I used to compile the data.

Now it’s time for some notes:

  • Originally I had compared the growth of these samples to the original data. But realized that the comparisons weren’t valid because each sample grew over 5 hours and the samples were independent of each other at this point.
  • It is interesting to note that the D2O sample is almost the same in every sample, except in hours 4 and 5 where the growth is more from incubation at 30C than RT (~25C). But even those two data points are almost identical.
  • The DI sample has more steady growth in each sample. I should compare these values to what they were when they were removed from the incubator.

I don’t know if this data is useful but I thought it was interesting so I thought I’d share it with the world. If you have any suggestions for this particular experiment let me know (comment, twitter, email, snail mail, etc)!

Yeast Growth Trial 1 Data

Here is the data courtesy of figshare:

S. cerevisiae growth in DI Water, DDW, 50% D2O, and 90% D2O. Anthony Salvagno. Figshare.
Retrieved 22:01, May 22, 2012 (GMT)
hdl.handle.net/10779/bfceb213ffb663b34149d97141755232

I would say this data is pretty exciting. Unlike the E. coli data (which was all over the place), there is a clear difference in growth rates between the D2O samples and the H2O samples. Also the growth between the DDW and DI (the H2O samples) were almost identical! That’s pretty solid.

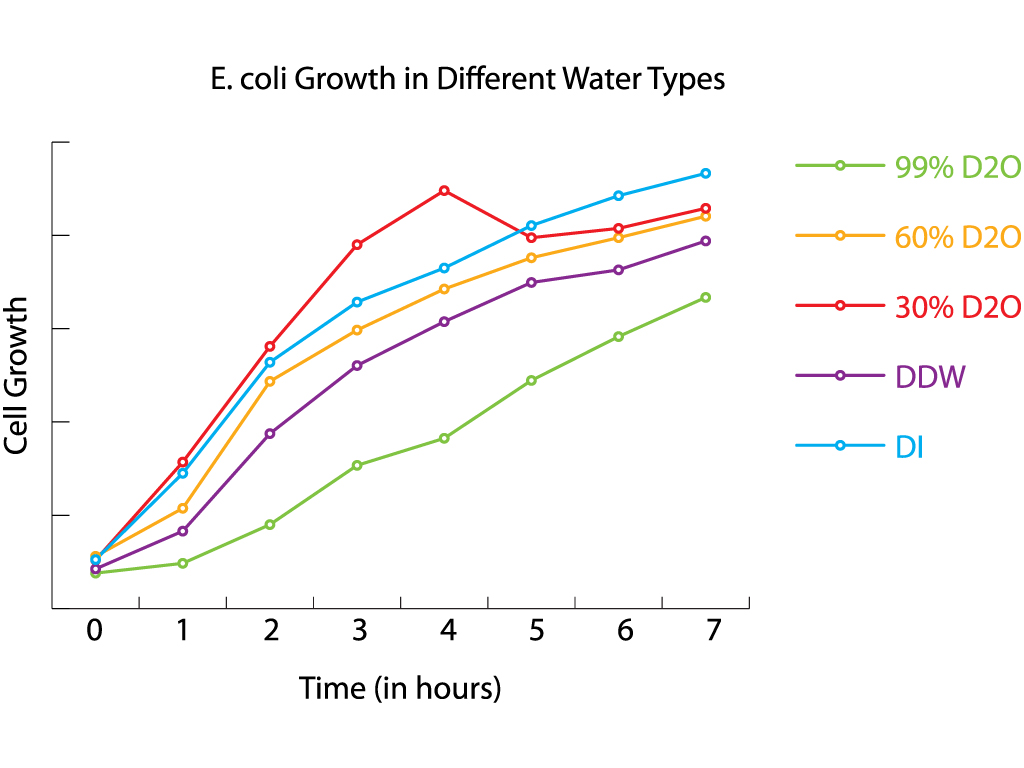
A cool figure I forgot to share: E. Coli growth in Water

the e.coli data reimagined in illustrator

I made this figure for my rockethub proposal and forgot to post it here in my notebook. Look how pretty it is!

I made this in Adobe Illustrator and if anyone is interested I would be willing to host an online workshop to teach others how to use Illustrator for science. This particular image took almost no time (maybe 30 minutes), which is a marvel because I obsess over everything I do in Illustrator (which is why there isn’t anything tangibly Illustrator on this site).

E. coli growth in different water types data

Via figshare:
E. Coli Growth in DI, DDW, D2O, 30% D2O, and 60% D2O. Anthony Salvagno. Figshare.
Retrieved 23:35, Apr 27, 2012 (GMT)
hdl.handle.net/10779/51fcd2f94fd7464449ee0f794642214c

I’ll post some interpretations here later…