Another Update on the Tobacco Seeds

I was going to use this space to compare the two different lenses, but I was so enthralled with the quality of the one 10x lens (from Opteka) that I ended up just taking a bunch of pictures with the one lens and thought I would share it all with you.

I tried to do some reading on the subject over the weekend, but it appears there is a term called root hairs that appear during growth of the primary root (which is what the radicle turns into). Now the books I read were limited in their germination physiology but at least I now have a foothold.

I did note while taking the pictures that in every case, the DDW seeds had the most root ‘fro, then the DI water seeds, and then the tap water seeds had the least. I still think this is a product of lack of nutrients, but there may be something in the question “Why would the root fro be more prominent in deuterium depleted water than in deionized water?” They are both pure, but maybe ddw is more pure than di water? Something to investigate I think.

I encourage you to enlarge every picture up there and see the amazing resolution one attains with the Nikon D40.

Lens Comparison For Plant Data Acquisition

While trying to take the initial waves of pictures for the tobacco seed experiment I discovered the problem of trying to get enough detail. I settled for using some random lens we had in the lab and I created a setup to keep the camera, lens, and sample in line to take a good, clear image.

Then I ordered some lenses that would screw onto the front of Koch’s Nikon D40 from amazon. Well I got the second lens today and I did a quick compare of the two systems which you can see above.

The first lens is a 10x lens from Opteka. It seems to be well constructed and nicely comes with a cap so I can leave the camera setup and protect the lens. The second lens is actually a set of lenses from Sakar. There are four lenses in the set and they are labeled +1, +2, +4, and +10 which I’m guessing is actually the magnification. The cool thing is you can chain them to increase the power of the lenses. The most I can go is using the +10 and +2 because I can’t focus beyond that magnification. The photo above was taken with that setup.

It appears that the Opteka lens is slightly more detailed and may have better color production. In that image you can actually see more root ‘fro then with the other lens(es). I will take more pictures tomorrow to do a deeper analysis, but the results look promising. Also of note that the 10x lens seems to have the same magnification as the +10 and +2 combo, which is interesting to say the least.

Experimental Ideas for Effects of D2O on Life

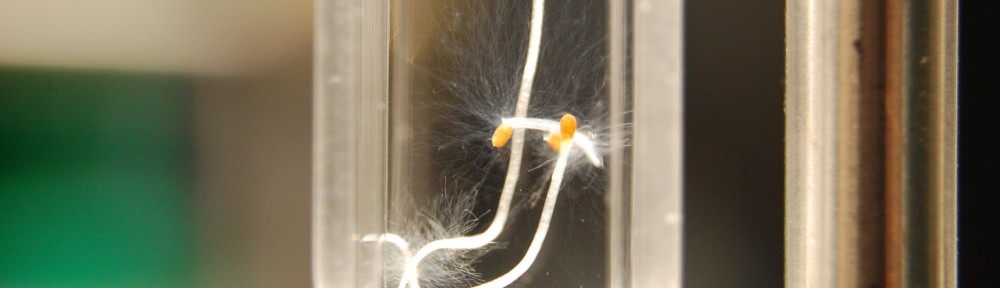
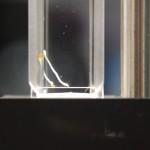
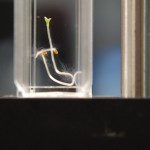
Reading some papers by Lewis and others at the time got me thinking about cool experiments. There is one that I want to replicate where it was stated that plant cells become hypertonic (cell shrivels up) in the presence of D2O (Brooks et al, 1937 which I need to find). This leads me to want to test red blood cells and human cheek cells (because they are easy to get a hold of) for similar effects.

Reading the paper by Lewis revealed some funny results when dealing with mice (he reports an intoxication effect when one mouse drinks heavy water) that intrigue me. But also gave me an idea. I would like to test the effects of D2O on the Tardigrade which is  a microorganism in the animal kingdom. This thing (nicknamed the water bear) is known to survive the most extreme conditions. From Wikipedia:

Some can survive temperatures of close to absolute zero (−273 °C (−459 °F)), temperatures as high as 151 °C (304 °F), 1,000 times more radiation than other animals, and almost a decade without water. In September 2007, tardigrades were taken into low Earth orbit on the FOTON-M3 mission and for 10 days were exposed to the vacuum of space. After they were returned to Earth, it was discovered that many of them survived and laid eggs that hatched normally.

So you can see why I’d want to put this thing in D2O and see what’s up. I found one place that sells them, but I get the impression they sell only one per order and I would like to grow them (which requires two surprisingly, because of the egg thing). I have read that they grow on moss and lichens so maybe I can get some live samples over at the Rio Grande.

In an email correspondence, Koch pointed out that testing with paramecia might be a worthwhile venture as well. They may exhibit visible response in the presence of toxins or at least will definitely slow down and die quickly.

As an aside, in biology class in 9th grade we were given some paramecia to examine and I watched as mine spontaneously exploded in front of my eyes. I told the teacher about this and she couldn’t care less. Thanks a lot Mrs. Cuesta (here’s a Google link for you).

Bill Hooker on friendfeed also suggested an interesting experiment:

You can D-replace prokaryotes… what would happen if you did that for 100, or 100 million, generations, then switched ’em back to regular water? Can you H-replace ’em using D-depleted water? I’m trying to come up with ways to adapt some enzyme or other to D, wondering if you could get it sensitive enough that adding D to a system using that enzyme would act as a switch…

Which got me thinking that maybe I could get these creatures to live in D2O by slowly integrating more deuterium to regular water over time. I read a paper by Keith Hobson where they analyzed the source of hydrogen in quail tissues by feeding a group water with D2O mixed in. By combining their results (which I’ll need to reread) with what Bill says, maybe I can get a species (of anything really) to live in D2O and analyze the effects of regular water on them. Could be fun.

Wow I can get carried away. I started this post as an aside where I was just going to list some quick thoughts and then started rambling. It’s all good.

Also if anyone has read to the end of this post, can you tweet this post? I want to check the ability of Disqus to search tweets and include them in the comments (the Reactions section). Also try sharing via facebook, or whatever other social media that you may use these days. Thanks in advance.

Ovalbumin, Catalase, and Kinesin Aggregation Data

I was going to publish some data with explanations very elegantly and awesome. Unfortunately I just found out that I don’t know what like 75% of the data actually is. I’m not going to point fingers but for this I’m sorry. I will still publish some data and I will try to explain what we are both looking at but unless I say for certain what the data is representing then the results can be mostly disregarded. By doing this I hope that I will present information to you like a jury sees evidence that gets stricken from the record (while not actually admissible in court the fact remains the jury did see something that could influence their brains in some capacity, and that’s what I hope to do to you!).

Onward!

I’m going to start with data that I’m positive about so we get off on the right foot. This is the aggregation data for the enzyme catalase which I know nothing about but used because we had it in lab, we had a lot of it, and because ovalbumin wasn’t aggregating and damn it I wanted to see some aggregation.

Catalase in D2O
Catalase in D2O with no aggregation
Catalase in DI water

In the above experiments we are analyzing the aggregation of catalase in D2O vs DI water. In the first data set I’m guessing the enzyme aggregated and we were changing the laser power down. For some reason the machine had difficulty reading intensity counts over 8 million so when it approached that number we had to decrease the power. In the second and third sets, the experiments proceeded as expected. In DI water we were able to visualize aggregation, and in D2O aggregation was suppressed for the same experimental conditions.

Now we get into the data I’m not sure about, but I would venture to guess that these next sets are ovalbumin aggregation experiments.

Ovalbumin in DI water. It aggregates...
Ovalbumin in D2O, it doesn't aggregate...

I know the data is sloppy, but it is also a bit inconsistent. In these last two experiments, the temperature was raised consistently while taking data from 25C to 90C. Because of the rapid temp increase (10 min perhaps) aggregation was not noticed until the temp was around 85C (instead of the reported 75C). When we took data slower (temp would increase in increments of 5C and hold for 20 data points taken consecutively every 3 sec) the aggregation temp would be closer to 75C.

Kenji REU Final Report

All work here is done by Kenji Doering (with some help from me and his official mentor Nadiezda Fernandez Oropeza aka Nadia).

Below you will find the final report of the findings of the work that Kenji did regarding the effects of D2O on kinesin stability. (Note: This was surprisingly easier to embed then a youtube video.) I will give a brief summary of his findings and if you want to read more then just check out the Scribd embed below.

Using dynamic light scattering (DLS) we hoped to find that kinesin would be less prone to protein aggregation when suspended in D2O. DLS is a machine that detects laser light scattering to determine particle size in a solution. The machine will attempt to measure the particle sizes, but we only need to know that particles in solution are getting larger and don’t care about the actual number. So for this we just need to know the intensity of the scattered light. A higher intensity reveals larger particles, where a lower intensity means smaller particles.

Proteins tend to denature (unfold) over time but will also unfold if certain conditions are met. A lot of times (all the time?) denaturing can be induced by increasing the environmental temperature. For kinesin this temperature is relatively low (in the mid 40’s C). We tested the hypothesis with ovalbumin which is a rather abundant, cheap, and commercially available protein. Ovalbumin has been documented to denature and aggregate around 75C.

Consistent with the literature, we found that ovalbumin did aggregate around 75C. We also discovered that it would inconsistently do so. According to a literature search by Kenji, he found that ovalbumin may also enter a secondary structure that actually hinders the aggregation process. In many studies, we found that ovalbumin wouldn’t aggregate at all, which we were able to ascertain by eye (when aggregation is achieved the solution becomes a cloudy mixture see Fig 2.0 in the report). In unpublished (as of this moment) experiments we used a different protein called Catalase that seemed to aggregate every try.

While we couldn’t get ovalbumin to aggregate consistently, we did find that it never aggregated in D2O at the same temperatures. In most cases the intensity of the scattered light would rise slightly and then decrease back to the baseline readings. The catalase also didn’t aggregate in D2O (more on this later).

Kenji was able to perform one kinesin experiment with D2O hoping to detect no aggregation. Unfortunately one sample cost $300 and we only had enough commercial kinesin for one sample. While we did see an unsuccessful aggregation event similar to the event in D2O with ovalbumin, one experimental success is hardly grounds for declaration (and Kenji suggests more work needs to be done as well). This is where I pick up the pieces and move forward.

As I said before, you can read his entire written report below. Also I’m making all the Google Doc data public which you can find here.

Kinesin Stability in D2O

A main focus of the lab is to examine the effects of D2O on the kinesin motor protein. Andy Maloney (now Dr. Maloney) spent quite a bit of time perfecting an experiment known as the gliding motility assay which allows an experimenter to study kinesin processivity by analyzing microtubule movement. Microtubules are relatively long protein filaments that kinesin has the ability to “walk” on which it does to carry cargo to various locations of a cell.

Below is a video of the gliding motility assay. Since kinesin molecules are too small to be resolved we actually depend on seeing the microtubules (which are in turn only visualized because of fluorescent dye proteins. What we are seeing below is that the microtubules (squiggles) are being propelled by the kinesin.

The reason that I mention this is because Andy used these experiments to determine if D2O affected kinesin movement at all. Initial results looked promising because it appeared kinesin would push the microtubules slower than identical experiments in regular DI water. It turns out that the decrease in speed could be related to the increased viscosity of deuterium oxide.

Despite this, Dr. Koch hypothesizes (based on introductory reports by Gilbert Lewis, a very popular name on this blog, and others regarding life in general) that D2O can stabalize kinesin. What do I mean by this? Well proteins in general don’t retain their shapes forever. There is some probability that a protein can denature (unfold) and this is expedited by certain cellular conditions (temperature, time, function, pH, charge, etc.). So it is believed that the inclusion of D2O can affect these conditions to ensure the “survival” of the protein. Currently kinesin suspended in buffer has a relatively short shelf life (but I’m not familiar with the lifetime). This would be very useful for use in the lab when chemicals, proteins, etc are stored for long term use.

We have proposed a couple of experiments that may help determine if deuterium oxide does indeed affect the storage life of kinesin (and perhaps other proteins/enzymes). The first is to detect aggregation which happens when proteins unfold and stick together to form large clumps of amino acids. The second experiment would involve detecting decreasing kinesin activity over time possibly through ATP hydrolysis (ATP turning into ADP+P).

Over the next few weeks (months?) I will be exploring these avenues. I have a slight head start on experiment 1 because an REU student named Kenji Doering spent the summer in our lab and explored the possibility of D2O affects on stability with ovalbumin which is a protein from egg whites. This will of course be the topic of my next post (or two) and I will be posting some rather interesting data from those experiments and some others.

Updated Preliminary Tobacco Seed Growth “Results”

Those are images of the first batch of samples (Dark Virginia seeds, not pre-soaked), I’ll take pictures of everything and post it next week. But here are the preliminary reports of what different water types do to tobacco seeds:

  • Every seed submerged in deuterium depleted water (DDW) sprouted little hairs on the initial root (the radicle). The interesting thing is this happened almost immediately after emerging from the seed coat.
  • Typically the seeds submerged in deionized water (DI water) germinated the slowest. More will come on this when I replicate the Crumley experiment.
  • Little hairs sprouted inconsistently on the seeds in tap and DI water but are more prevalent on the DI water seedlings. They are not as abundant on these seedlings as they are on the ddw seedlings. If I had to give an analogy (and I do) then I would say the ddw seedlings can grow a nice ‘fro, while the other seeds exhibit male pattern baldness.
  • The little hairs remain localized on the end of the root and aren’t distrubted along the hypocotyl (early stem, and I almost said axon, lol!) so I’m inclined to believe that this is an early root system that is developing because of a lack of nutrients in the water (seen on ddw, most DI, and almost no tap water seeds). But I’m no botanist so I’m just guessing. The fact that the hairs are really prominent in the ddw seeds might suggest the plant recognizes the lack of deuterium, but I’m not willing to make that leap yet.

I setup a new photography system for these seeds. Dr. Koch lent me his Nikon D40 dSLR camera and I purchased some magnification lenses for it. I have the camera setup on an optical post and use a cylindrical lens holder to mount the seed samples (in cuvettes). The picture quality is much better now, with a much higher resolution. I’ll be looking into microscope images soon. Soon I’ll be developing a reliable way to measure the germination, but let’s not jump the shark now. All will be revealed in due time.

Also I was going to measure the pH of the samples at this stage of their development to gain some insight into whether the germination event drastically alters the pH, but the probe in the lab is too big and I don’t have enough sample volume. So I’m thinking that next week I combine the volumes of the water (of each type) to do one “average” measurement. There are four samples of each water type, two for each seed species, and each is filled about 2ml which would give me 8mL of combined volume for each water type. I’m just waiting for the pre-soaked samples to reach full germination (ie shed the seed coat). Now I’m not saying this will work, and it may not be reliable, but hopefully it is a decent approximation for expectations for now until I learn a little bit more.

Repeating Crumley et al (1950)

Koch asked me in a comment to replicate an experiment done in 1950 by Helen A Crumley et al demonstrating Tobacco seed growth in deuterium oxide (D2O). The experiment is rather simple (and the figure from the paper is shown below) as Crumley placed 100 seeds in differing amounts of D2O (double distilled water, 33%, 66%, and 99.8% D2O) and analyzed the growth.

Influence of ordinary water, 33%, 66%, and 99% deuterium oxide on tobacco seed germination. Counts made at daily intervals for 39 days. (From Crumley, Fig 3)

So here I am planning the experiment. I will change some things from their experiment. First they placed the seeds on wet cloths (paper towels?), and I will submerge the seeds in the water amounts they used. They also used a variety of plant species (tobacco, clover, radish, Kentucky bluegrass), where I will just use tobacco seeds (but I will try two different species). Finally they talk about their results in terms of percent germination, but it isn’t clear from the paper if they mean number of plants that have exhibited germination, or if they are referring to some amount of growth exhibited by each plant. I will look for both possibilities and report the results as I find them.

In a preliminary experiment I will submerge the plants in water in petri dishes and seal it with parafilm. I will be looking into a more airtight solution as time goes on. I also won’t do 100 seeds but probably on the order of 33 seeds per sample. And in the future I will look into figuring out a way to measure the seed growth.

Original Crumley paper can be found here.

OpenPCR: Understanding the Final Hold Issues

I’ve been writing about the OpenPCR platform for a couple weeks now and together we’ve had our ups and downs. The most prevalent issue that I’ve had in my tests is a failure to hold. By that I mean, after completing a program, a PCR reaction is usually set to hold at a certain temperature in case the user isn’t around to claim his prize (a complete reaction). I usually set the hold at 4C but discovered OpenPCR can’t handle below ~12C, but I’ve also discovered that in my case (maybe other cases) the machine doesn’t hold at all. It just ends the program and returns to room temp.

So today I investigated…

The short results: I could not consistently get the machine to hold after trying multiple programs. Nor could I get the machine to run the designated program consistently. When the machine did perform a hold in two cases there was a glitch in the LCD, but otherwise reports are ok.

Now for the long answer:

I ran 5 experiments and then gave up. I don’t like admitting that, but after a couple hours of frustrations I think it is warranted noting. Here are all my notes:

  1. I ran the “Simple Experiment” that is pre-programmed into the software. On my first attempt (this is after completing the PCR experiment I posted earlier), the experiment crashed. The software displayed “Done!”, while the machine sat idly. (Get used to that because this will happen a lot in this discussion.) I tried to restart and this time the machine did nothing while the software displayed the time left screen. I turned the machine off and on and tried again. This time the program ran and the machine cooled to hold after completion. While in the hold phase there was a glitch on the LCD that said “Final H” and next to the H was a rectangle and three stacked horizontal lines. (I should have taken a picture of that screen 🙁 )
  2. I reran the “Simple Experiment.” On my first attempt the machine did nothing while the software displayed the time left screen. I turned off and on the machine. Tried a rerun and this time, the machine held at 20C. It again displayed that weird screen on the LCD.
  3. I created a new program: 1 cycle – 12C (for 30s), 20C (30s), 30C (30s), hold at 12C. On my first attempt, the lid heated and the software said done. Then the program started and the software started the countdown (after saying Done!). The machine got to about 15C and stayed that way for a while (time unknown) and so I stopped it. I tried to run the program again, but changed the lid heating to 0C hoping it would just not activate the lid. This time the program never started and the machine did nothing. I then changed the lid temp to 75C because I noticed it was cooling and thought maybe it needs to reach some temp before the program could start. The machine never started running.
  4. Another new program: 1 cycle – 37C for 30s, hold at 20C. On the first try (yay!) the machine ran, completed, and held. The LCD actually read “Final Hold” too. On a second attempt, the software said “Done!” but the experiment hadn’t started yet. It then ran and completed.
  5. In my last experiment, I did 1 cycle – 16C for 30s, hold at 16C. I tried twice, and both times the machine never started the program.

By that point I had given up and decided to do this write up. If I had to guess I would say there is a glitch whenever the software asks the machine to hold at anything less than 20C. There is definitely a glitch if you want to do two experiments back to back, because a lot of those times is when the machine would not do anything after completing the first of the back-to-back experiments. Other than those observations I have to give a big shoulder shrug and hope that the OpenPCR guys can give me some troubleshooting ideas. Anyone else with the system having any problems?

OpenPCR Reaction Try 2

1% Gel Stained with Sybr Safe

Today I ran the same reaction that I ran on Friday, this time I did two sets of reactions. One set, I put in the OpenPCR machine and the other set I placed in our Thermo thermal cycler. The image on the left shows the results. Lanes 1-5 contain the samples from the OpenPCR machine (Lane 5 also contains a 1kb ladder), and lanes 6-10 contain the samples from the Thermo machine. The bands are brighter towards the top than towards the bottom because I stained prior to running the gel (and the stain runs in the opposite direction from the DNA). I tried to post-stain for about 15 min to improve image quality.

Notice that the bands are all the same length and the same brightness, which was not the case in the reaction from last week. The spreadsheet of the reaction can be found below.