Category Archives: RC1

The Repeating Crumley-ONS Project: Next Steps

Slightly over a month ago, I came across the Winnower and began a project in open notebook science. The concept was to upload notes from my notebook to the Winnower, archive the notes, and get DOI’s for each post. Then I would write 2 papers: one to summarize the experiment and the other to theorize a complete publication system that would incentive open documentation of real-time research (open notebook science). I chose the Repeating Crumley experiment for this experiment in ONS, and you can read about the reasoning here.

Well I’m happy to say that I’ve completed Steps 1, 2, and 3! I’ve posted every notebook entry in the RC series (there’s a physics pun there somewhere) to the Winnower and received DOI’s for almost every post. A few posts didn’t translate, at all, on the platform. They are uploaded, but I didn’t bother with the DOI. Regardless, you can go on any of my Winnower posts and get a DOI (or click through to my notebook),  or look through the RC entries and click the DOI to get to the Winnower archive of that post.

One cool side effect of this project was that a Twitter friend noticed a post that had embedded .gifs and I think I am now credited with being the first to publish a scientific paper with embedded .gif’s.

Now it’s time to write the paper based on all this research. I got the process started a couple years ago with a Google Doc about the project. I think I never followed through, because I didn’t value the traditional publication process. I think open science and peer review publication are on a course to merge and the incentives for ONS will shift, but this is a topic for another time.

Anyway, here is the previous write-up which I’ll work on, merge with some info from my dissertation, and to which add some new thoughts.

This part may take some time…
Repeating Crumley Experimental Data on FigShare!

It took me a while, but I finally got my data from the Repeating Crumley set of experiments up on FigShare. Of course, I didn’t call it Repeating Crumley there since that experiment has no context. You can download the data sets and figures here:

Repeating Crumley FigShare Data and Figures

The interesting thing about this site is that your data remains your data but is openly accesible. Each upload is given a citation. Mine is:

Salvagno, Anthony; Koch, Steven J; Salvagno, Anthony (2012): Repeating Crumley: Tobacco Seed Growth in D2O. figshare.
http://dx.doi.org/10.6084/m9.figshare.89655
Retrieved 22:15, Mar 02, 2015 (GMT)

Also there is a little section for social media promotion and it tracks the page analytics for you as well. That is pretty neat!

It did take me a while to get this up on FigShare unfortunately. For a while I couldn’t log in with Twitter, Facebook, or Google. I was asked repeatedly to sign in while trying to upload stuff. Eventually I just gave up and created a new account. Then when I tried to upload my first images, the site was unresponsive. I did spend a considerable amount of time organizing my resources so it would be presentable on FigShare, so that added to the mess a bit. And I also spent some time collecting links from my notebook to incorporate with the data so all experimental information can be collected. I also monified my active experiments page a little so some of the links are easier to navigate.

Despite how time consuming this first run was, it was definitely worth it.


Repeating Crumley: Seed Growth vs Time

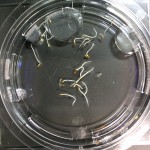
As you know I posted pictures of the seed growth every day. Well a couple of days ago I decided to organize the pictures by sample in one post as opposed to by day. This way you can see the growth of each sample over the 15 day period. The posts are already posted but I figured I would compile the links here with some commentary so you know what’s up.

As you can see trial one wasn’t a huge success in this regard because every so often I would shift the seeds around. It makes it hard to track each individual seed, but with that said there are some obvious things you can take away:

  • You can really see the growth over time. It’s hard to keep track on any given seed in each sample, but on an average you can really get a feel for how quickly these seeds develop compared to the other samples (ie the stuff in di water grew first compared to the stuff in 66% D2O).
  • You can track the evaporation rate decently enough. This was a major problem towards the end of the experiment and you can really see its effect.

Overall I’d say I did a decent job with this experiment given that it was a first try. I’ve managed to improve some things for Try 2 and I’ll be making more improvements when it comes to Try 3, which hopefully will be good enough for an official experiment.

BTW: The plugin I used to create the slideshows is called Portfolio Slideshow.

Repeating Crumley: Day 15

Last day, hooray! Final preliminary (how’s that for an oxymoron?) thoughts coming tomorrow.

Repeating Crumley: Day 14

Second to last day!