Remember this experiment?
Checking in on it, the YPD has already begun it’s aggregation in both cases, but it is more prevalent in the DI YPD case. Which should be expected. At this point I can see a concentration gradient in both solutions, but the full-on aggregation hasn’t happened yet. As is, it’s not worth photographing because there isn’t much difference.
But thinking back to here, I remembered we used a Dynamic Light Scattering Machine (the DynaPro Titan TC by Wyatt), which just uses scattered light to calculate particle size. In the aggregation experiments we didn’t care so much about specific particle size, just that we wanted to see the particles grow bigger.
If in fact the YPD is aggregating, the solution would become cloudier by eye. So since our Nanodrop measures absorbance, we could potentially see the same effect. The catch is that the DLS machine mentioned above measures at 830nm, and my nanodrop measures a broad spectrum from 250nm-700nm. In that range I’m not sure where it is most accurate except at 260nm, 280nm, and 600nm (which is where it measures DNA, proteins, and cell counts).
I’ll do a more thorough study on Monday, but here is the quick analysis:
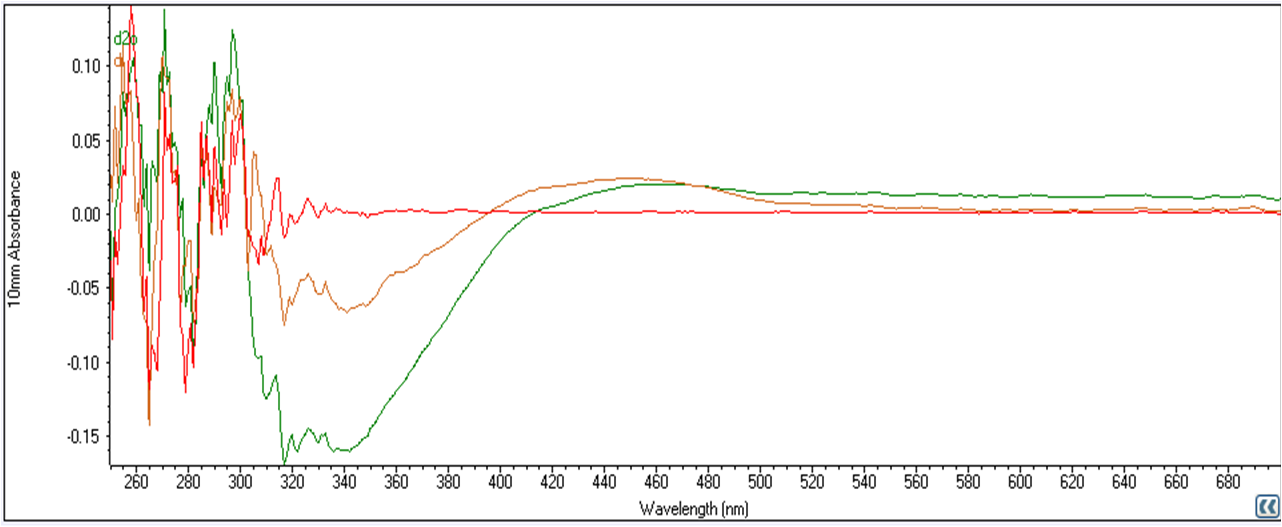
orange – aggregated DI YPD
green – aggregated D2O YPD